You can generate an Aggregation report for multiple streams only if all those streams are of the same type (such as Level), and use the same unit of measurement (such as inches).
To create an Aggregation report:
- Click Reports in the left pane. The Aggregation Report window opens.
- In the Aggregation Report window, do the following actions:
-
Select whether to specify streams By Site or By Stream Type.
-
If you selected to specify streams By Site, specify the site, and then specify stream(s) in the site.
-
If you selected to specify streams By Stream Type, specify the stream type, and then specify stream(s) of that type.
-
Specify the reporting Time Period.
-
- Select the aggregation period - from 1 min intervals to 1 month intervals.
- If you select to run the report for multiple streams, do the following actions:
-
Select which statistical analysis function to run on those streams: either Sum, Average, Min, Max or Standard Deviation.
-
Specify Separate Streams if you wish to run a separate analysis for each of the specified streams. For example, if you had specified Stream1 and Stream2 and chosen Average, then do either of the next actions:
-
-
-
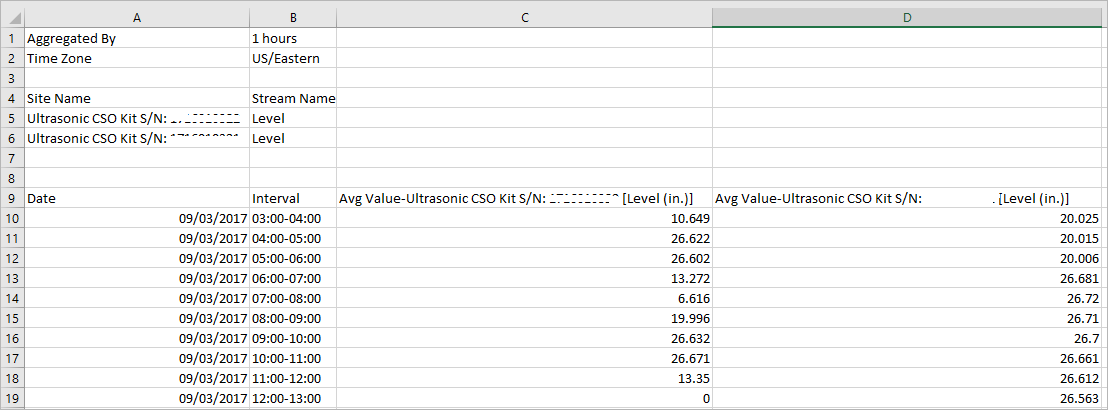
- Select Separate Streams to provide the average of all Stream1 recorded values in one column, and the average of all Stream2 recorded values in a second column.
- Clear Separate Streams to provide an average of all Stream1 and Stream2 recorded values, in a single column.
-
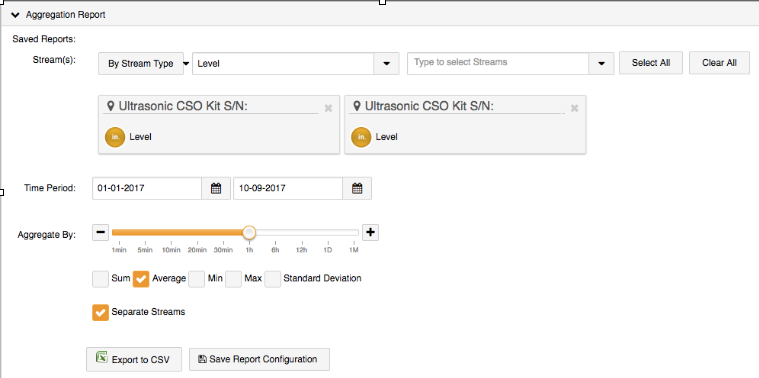
5. If you select to run the report for a single stream, you can run any combination of the following statistical analysis functions: Sum, Average, Min, Max or Standard Deviation.
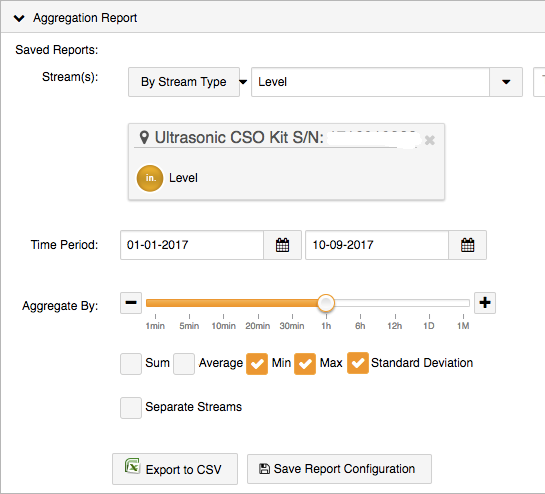
6. Click Save Report Configuration if you wish to save this specific report generation criteria, and enter a descriptive name for the report type
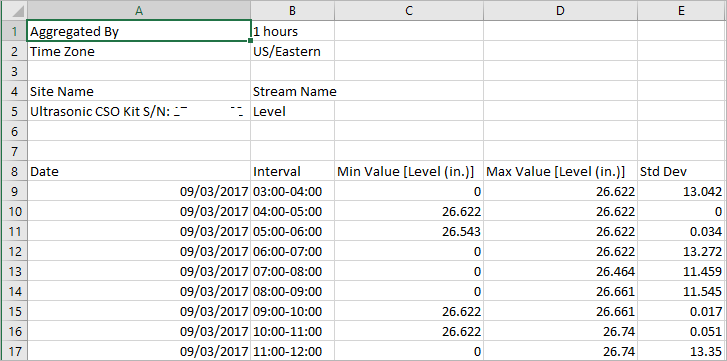
7. Click Export to CSV. A CSV file is created, showing the results of the statistical analysis for the selected period. For example: If you specified two streams, the Average function, and Separate Streams in the report criteria, the resultant report will look similar to the following:
If you specified a single stream, and the Min, Max and Standard Deviation functions in the report criteria, the resultant report will look similar to the following: