To compare data streams:
- Go to the "Visualization" panel.
- Click the first data stream in the Sites Tree pane. The right pane splits, displaying the data in a chart in the bottom half of the pane.
- Click the second data stream in the Sites Tree pane. The data appears in the same chart in the bottom half of the right pane.
- Repeat step (2) as needed. If you select more than five data streams in all, or more than two different types of data streams, the data from the additional data streams will appear in a new tab.
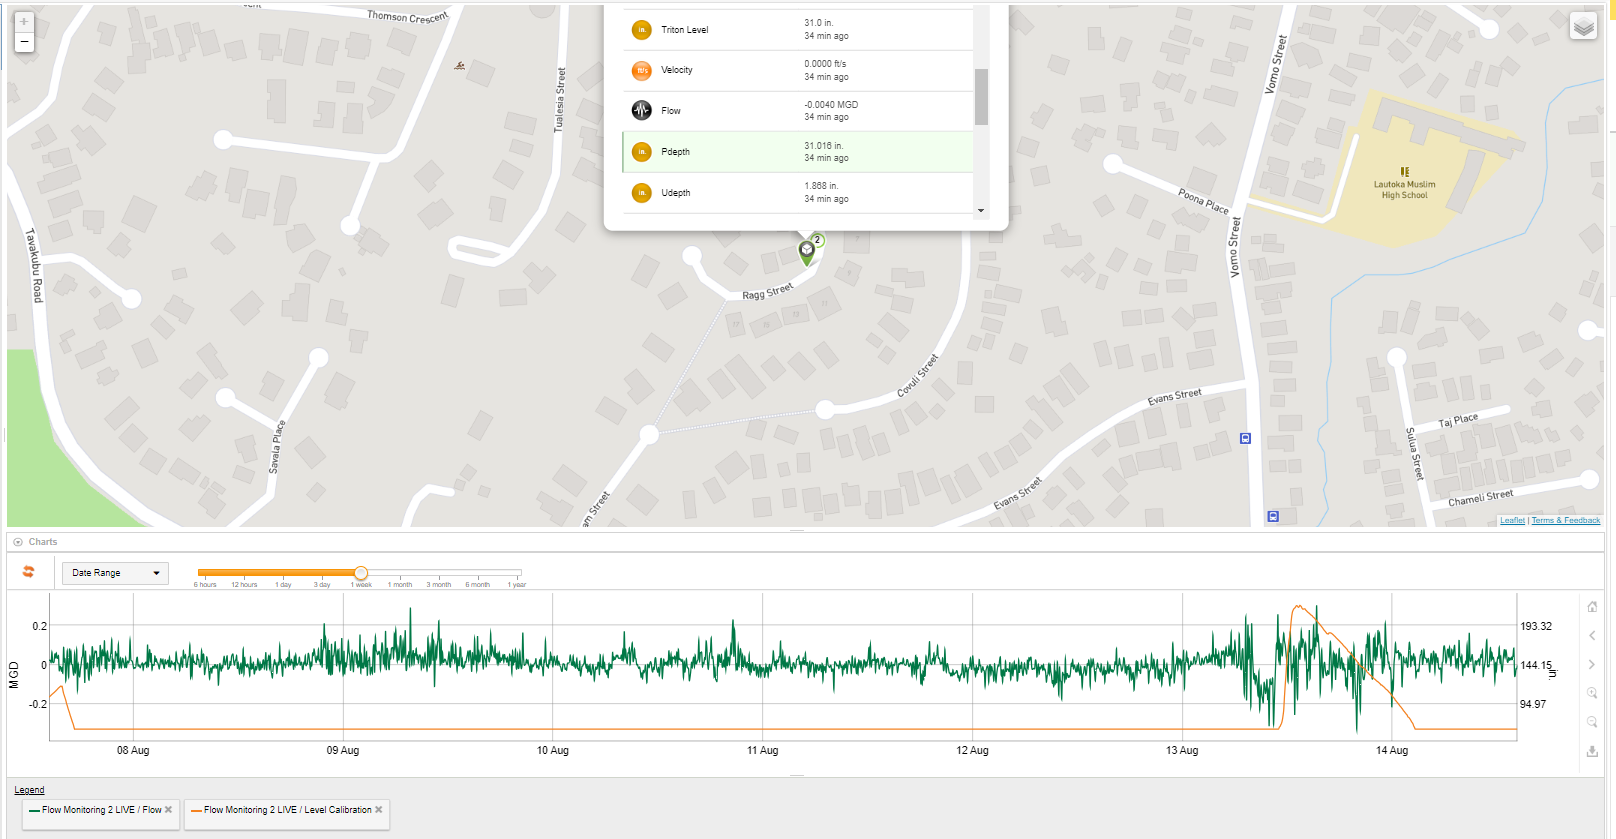
The following example shows a comparison of two data streams from the same site.