Contents
Reviewing ‘Site’ information on the overflow
Prerequisites
- You must have the Account Administrator role.
- The ‘Storm Scope’ app must be enabled for your account. If you do not see ‘Strom Scope’ in the Fleet UI, contact sales@ayyeka.com.
Setting up the application
- Generate an API Key and Secret:


- Copy the generated ‘Key’ and ‘Secret’ to a text editor (e.g. notepad):

- Open the application:

- Go the ‘Settings’ tab:

- Define the measurement units:

- On the API section, enter the ‘Key’ and ‘Secret’ generated in the previous steps:

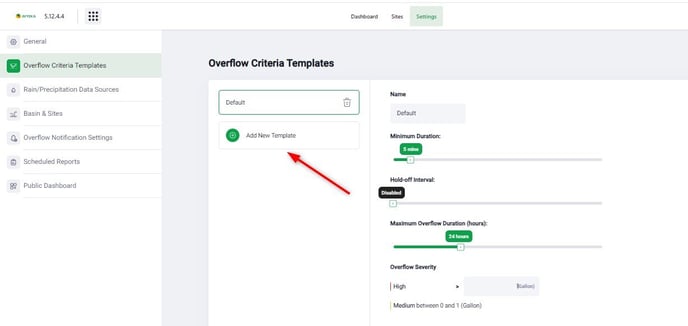
Name - the name for the template
Minimum Duration - parameter represents the minimum duration of continuous rainfall or water inflow that must occur before the system should experience an overflow.
Hold-off Interval - parameter is used to define a period of time between two consecutive overflow events. It serves as a delay before the system considers separate overflow events as distinct occurrences. For example, if the hold-off interval is set to 10 minutes, any overflow events that occur within 10 minutes after the initial overflow event will be considered as a part of the same event. The system will treat them as a unified occurrence rather than individual, separate events.
Maximum Overflow Duration (hours) - parameter sets a threshold for considering overflow events as a single unified event. If the duration of an overflow event exceeds this specified value, the system will automatically divide it into separate occurrences. For example, if the maximum overflow duration is set to 4 hours, any overflow event lasting longer than 4 hours would be divided into separate ones.
Overflow Severity - parameter is used to categorize the severity level of an overflow event within the system. This categorization is particularly useful for visualization purposes on the application map. The severity levels are classified into two categories: "Medium" and "High."
- Go to the next ‘Rain/Precipitation Data Sources’ section and click on ‘Add New Data Source’:

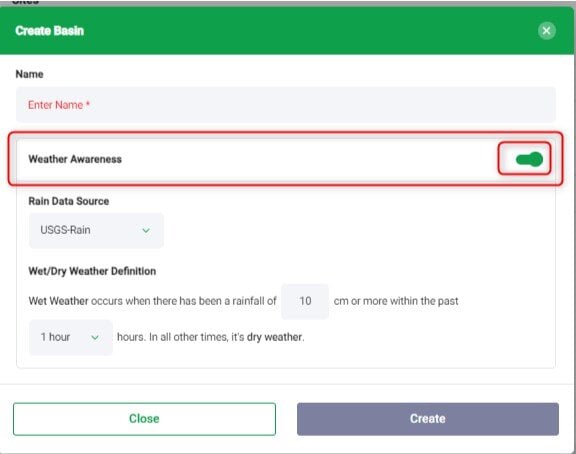
This template is needed to classify whether the ‘Overflow’ event has been caused by ‘Dry/Wet’ weather. 'Dry/Wet' weather refers to the prevailing weather conditions that impact the occurrence of overflow events in a system: - Dry Weather Overflow: A 'Dry Weather Overflow' occurs when an overflow event happens without any significant rainfall or precipitation. It can be caused by factors other than rainfall, such as excessive water usage, leaks, or other non-weather-related issues within the system.
- Wet Weather Overflow: A 'Wet Weather Overflow' happens when an overflow event occurs due to heavy rainfall or other water inflows.
If you need to specify the ‘Rain Data Source’ for the basin, you will need to enable - ‘‘Weather Awareness”:
10. Once the basin is created, it is needed to add a site:
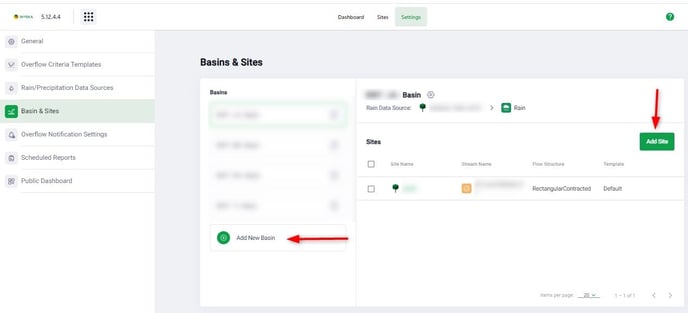

11. There you are defining the corresponding ‘Site’ and ‘Stream’.
Please note: the ‘Level’ source metric measurements should be the same as selected in the ‘General’ section.
12. In the ‘Flow Structure’ section specifies the type of the weir and its parameters:
13. In the next step, ‘‘Overflow Criteria’ specify the template created in Step #7.
14. Click ‘Save’
15. Now you will see on the ‘Device Management that there is a new stream created for the site:
16. Go to the next ‘Overflow Notification Settings’ section:
User Group - the list of users to receive the notifications.
Weather Type - Restrict the notifications to events of the specified weather type. Choose "Wet" to get notifications when a discharge occurs during wet weather. Choose "Dry" to get notifications when a discharge occurs during dry weather.
Notification Type - Email or SMS or both types of notifications available.
Templates - customer can define the templates for both: Started Event and Finished Event.
17. Go to the ‘Scheduled Reports’ section and click on ‘Schedule a Report’.
18. In the pop-up window, you will see the following parameters:
Reviewing ‘Site’ information on the overflow

Within the Storm Scope application, you can access information about events that occurred during your chosen time period for all connected 'Sites.' Simply click on a particular 'Site,' and you will be presented with more comprehensive and detailed information about the specific events associated with that location.
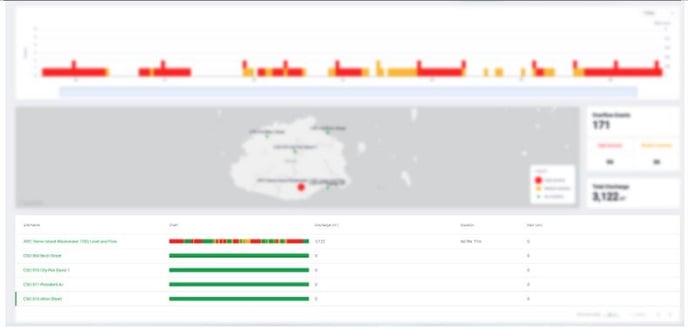
‘Dashboard’
The top widget seamlessly integrates data on both 'Overflow Events' and 'Raining Events,' providing a comprehensive overview of the combined information.

The next widget displays the 'Map,' providing a visual representation of the events. On this map, you can easily view and interpret the spatial distribution and locations of the various events.

The last widget presents general information about a specific category of the events (Dry/Wet Weather) that occurred within the specified 'Basin' and during the chosen time period.
Additionally, on this page, you have the option to generate the 'CSO Report.' This feature allows you to create a comprehensive report detailing (CSO) events and relevant data for further analysis and documentation.

