Contents
Getting Information about specific data points in the chart
Getting Information about specific data points in the chart
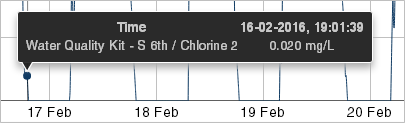
When you hover your mouse pointer over a point in the chart, a tool tip shows the following information:
- Timestamp
- Site name
- Type of data stream (such as Pressure, Level, etc.)
- The reading
Setting the Date Range
You can set the start and end date for the chart by clicking the Range drop-down and setting the dates.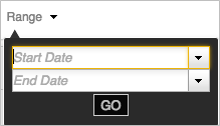
Setting the Time Frame
You can set the time frame shown in the window by selecting the desired time frame in the Time Frame selector.
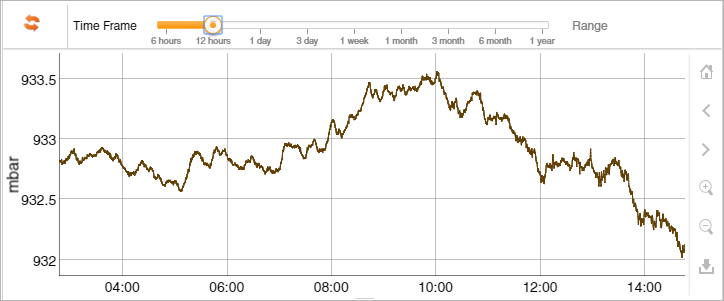
Using the Zoom and View tools
You can adjust the view using any of the following tools, appearing to the right of the chart:
 |
Zoom to initial view (1 week) |
 |
Pan left |
 |
Pan right |
 |
Zoom in |
 |
Zoom out |
 |
Download as .png. The graph opens as a PNG file in a new web browser tab. |