In the left pane, click Visualization to display the initial Visualization window.

The Visualization window includes the left pane, the Sites Tree pane and the right pane.
- Left pane – links to the 5 main views: Visualization, Reports, Devices, Account, and API. The available views depend on your permissions (role).
- Sites Tree pane – provides a searchable list of all devices sites and their data streams. The different streams of data are listed under each site, with the latest value and a corresponding time stamp for each stream.
The Sites Tree pane includes a Search box, which you can use to search for your sites.
If there are more than 5 search results, the results will not be displayed. In that case, you need to refine your search criteria.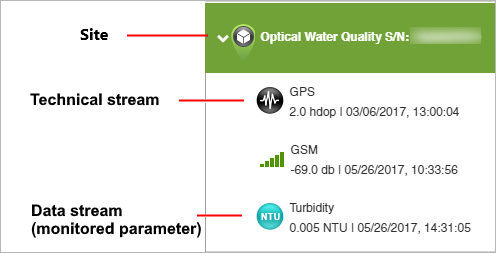
- Right pane - shows a zoomed-out map displaying clusters of data streams.
Using the zoom controls, you can zoom in for greater detail, down to an individual site and its data streams.
When you click a site in the Sites Tree pane, the right pane shows information about that site, such as the version of hardware, firmware, the IDs, and the last transmission.
